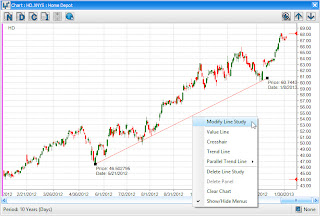
Applying a line study to a chart is super easy. First, click on the Line Study icon at the bottom of the right tool-palette and highlight the line study you want to add. Then click the Apply icon at the top of the tool-palette. I like applying trendlines so I'm going to use that as an example.
Then place your curser at the location you want the trendline to start and drag it to the location where you want the trendline to end.
 |
| Begin Trendline |
End Trendline
Once the trendline is in place you can modify it by changing its color, width and transparency. In order to do this, right click and then choose Modify Line Study.

A dialog box will appear where you can change the parameters. I decided to change the trendline color to blue.
After you choose blue and click apply, the trendline changes to the color blue.
There are a couple of additional features associated with trendlines. The first is a convenient feature displaying the data at the beginning and ending of the line. Another is the fact that you can create a parallel trendline. This feature allows you to easily create channels on a chart.


No comments:
Post a Comment